Where should bike share stations go?

english bikeshare poster hi-res

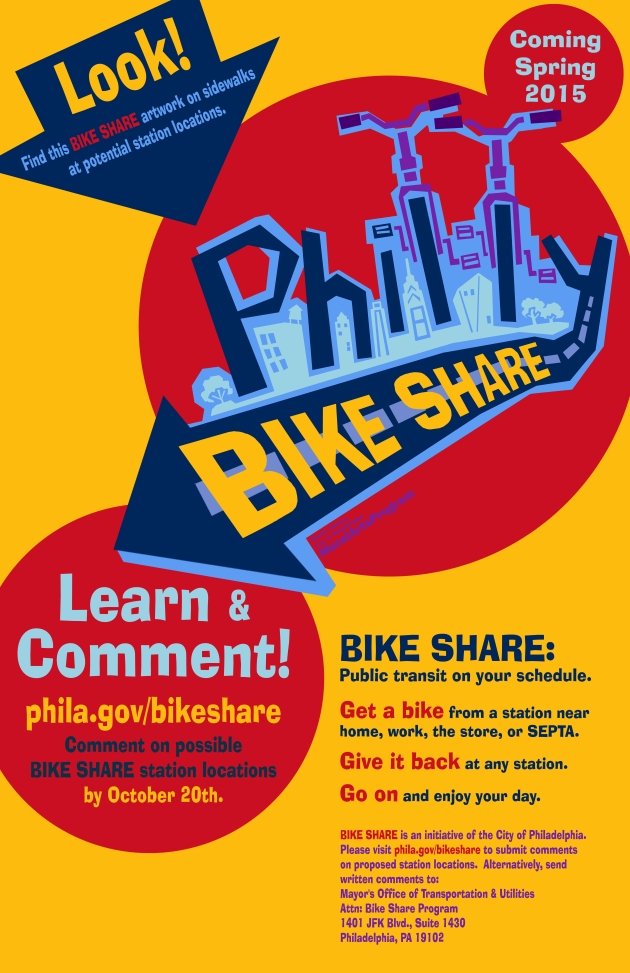
A map of potential bike share station locations is now live for comment via www.phila.gov/bikeshare, and we want to hear from you! We are collecting feedback on almost 100 potential locations and plan to launch with around 60. Your feedback will help us prioritize, relocate, and eliminate locations as we gear up for initial program launch this coming spring.

You can comment not only online, but also via text message. MOTU has partnered with the Mural Arts Program and artist Eurhi Jones to create a bright red vinyl decal marking the locations of potential bike share stations. When you see one, text your thoughts to the number you see. Philly-based tech start-up Textizen is powering our text survey, and the interactive map was created by OpenPlans using their Shareabouts platform.

What does it mean if a station is on the map?

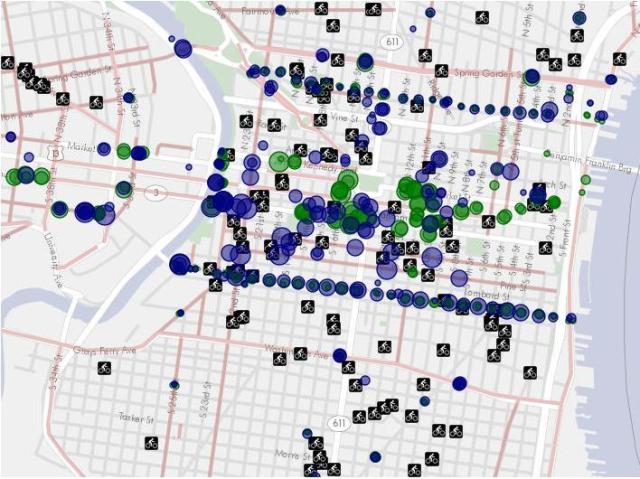
The map represents potential station locations, not definite plans. We identified potential stations based on analysis of factors such as:

  • population density
  • employment, cultural, and recreational destinations
  • transit stops
  • bike lanes
  • a crowd-sourced bike share station map that many of you commented on
  • site visits
  • meetings with property owners and community groups
  • meetings with agency partners, including SEPTA and Parks & Recreation

In most cases, the online map marks locations where we think bike share could make sense and could physically fit (stations are around 6.5′ wide and between 45′-75′ long). In other cases, the map shows an area that we think should be served by bike share, but in which we haven’t found a good spot. Look at the location description online to identify these (hint: the text begins with “HELP!”). Another insider tip: these locations don’t have decals.

What will we do with the feedback?

We will be using community feedback, in conjunction with meetings with property owners, community groups and other partners, to prioritize, relocate, and eliminate stations from the map. The goal is to identify a network of 60 stations that make the most sense for potential users and for system operations.

We will be presenting the findings of this initiative along with resulting recommendations at a series of public meetings later this fall.

Why isn’t bike share in my neighborhood?

The system will initially comprise 60 stations in Center City and parts of North, South, and West Philadelphia. We adopted this phasing plan as the result of last year’s strategic business planning process. Launching with only 60 stations means that we won’t initially be able to reach all areas that might be well served by bike share. We plan to expand the system in spring 2016 with an additional 60 stations, and will be using lessons learned from initial program launch and from the first year of operations.

We look forward to your feedback!

Tidbit Tuesday — Philly’s Parklets are Returning!

Every Tuesday, the Mayor’s Office of Transportation & Utilities (MOTU) posts a map or graphic that tells a story about transportation or utilities in the City of Brotherly Love.  This week is a graphic showing last year’s parklets’ locations.  These parklets will be opening for public use over the course of the month of April!

This map shows not only where parklets were located in 2012, but also what they were located next to.

This map shows not only where parklets were located in 2012, but also what they were located next to.

The locations in the above graphic are as follows:

  • Dauphin St & Frankford Ave
  • Wagner Ave & Old York Rd
  • 43rd St & Baltimore Ave
  • 44th St & Spruce St

In addition to the parklets listed above, Philadelphians will see at least two more parklets coming later this year!  The locations for these parklets are as follows:

  • Main St
  • 10th St & Cherry St
  • …and more to come!

Want to know more about parklets in Philadelphia?  Check out these previous posts on our blog:

What Streets do Bicyclists Take?

Check out this great map that Jon Sinker from the Philadelphia Department of Health put together showing the number of bicyclists and pedestrians that move through the city.

Bike-Ped_Counts_Map

This interactive map shows not only the number of bicyclists or pedestrians who pass by a specific point in the city, but also Philadelphia’s bike lane network and the locations of bike racks.

Take a closer look and see which streets are most used by bicyclists and pedestrians.  Streets with bike lanes, such as Pine, Spruce, and 22nd, are those most used by bicyclists, while the streets closest to City Hall appear to be the most popular with pedestrians.

The data was collected by the Delaware Valley Regional Planning Commission and they and the City are able to use this map to identify locations where active transportation is most prevalent. In addition to this, the map idenfities those areas in Philadelphia that are well used by pedestrians and bicyclists and could receive more investment.

Which streets in Philadelphia do you walk or bike on?

Be sure to explore some of The City of Philadelphia’s other great maps.

Tidbit Tuesday — How long does it take for Philadelphia to get to work?

Every Tuesday, the Mayor’s Office of Transportation & Utilities (MOTU) posts a map or graphic that tells a story about transportation or utilities in the City of Brotherly Love.  This week we will be exploring how long it takes Philadelphians in different parts of the city to travel to work.

CommuteTime

A couple weeks ago we took a look at the newly released transportation related Census Data.  We found that according to the US Census, Philadelphians spend 31.5 minutes traveling to work, above the national average of 25.5 minutes.  We then mapped out the average commute time, aggregated and averaged from the 2007-2011 American Community Survey to find which parts of the city had higher and lower average commute times.  Keep in mind that these commute times take into account all modes except for those currently working from home.  How long does it take you to get to work?

Tidbit Tuesday — How have commute patterns changed from 2000 to today?

Every Tuesday, the Mayor’s Office of Transportation & Utilities (MOTU) posts a map or graphic that tells a story about transportation or utilities in the City of Brotherly Love.  As a follow-up to our three-part series about how many people travel to work by driving, taking public transit, or biking/walking, this week we will be exploring how these patterns have changed between 2000 and today!

The first commuters we will look at are those who drive to work:

CPD_CTV_TidbitTuesday
The North and Lower North districts appears to have increased in the percentage of commuters who drive to work while the West Park, Lower Southwest, Lower South, and South districts all decreased the percent of commuters to drive to work.

The next commuters we will look at are those who take public transit to work:

CPD_PubTrans_TidbitTuesday

The Lower Southwest, Lower South, Upper North, and Lower Far Northeast districts appears to have increased in the percentage of commuters who take public transit to work while the Lower North and Upper Northwest districts decreased the percent of commuters take public transit to work.

The final commuters we will look at are those who bike or walk to work:

CPD_BikePed_TidbitTuesday

The Upper Northwest, Lower Northeast, West Park, and South districts appears to have increased in the percentage of commuters who walk or bike to work while the Riverwards district decreased the percentage of commuters that walk or bike to work.

These maps underline the facts that Philadelphians travel to work by a variety of modes and these modes can change from decade to decade!

Tidbit Tuesday — Who commutes to work by biking and walking?

Every Tuesday, the Mayor’s Office of Transportation & Utilities (MOTU) posts a map or graphic that tells a story about transportation or utilities in the City of Brotherly Love.   This week is the final post in a 3-part series exploring how people commute to work — see the first post about who commutes by car, truck, or van here and last week’s post about who commutes by public transit here. This week we will be taking a look at where people live if they are commuting by biking or walking.

WalkBikeCommute

According to the 2007-2011 American Community Survey, 10% of Philadelphians commute to work by biking or walking.  While this may be the average, there are many communities in Philadelphia, as can be seen by the above map (which is broken down by to the block group level and overlaid with Philadelphia’s Planning Districts), where average biking/walking commute rates are much higher or lower than this 10% average.

Tidbit Tuesday — Who commutes to work by public transit?

Every Tuesday, the Mayor’s Office of Transportation & Utilities (MOTU) posts a map or graphic that tells a story about transportation or utilities in the City of Brotherly Love.   This week is the second in a 3-part series exploring how people commute to work — see last week post about who commutes by car, truck, or van here. This week we will be taking a look at where people live if they are commuting by public transit.

PubTransCommute

According to the 2007-2011 American Community Survey, 26% of Philadelphians commute to work by public transit.  While this may be the average, there are many communities in Philadelphia, as can be seen by the above map (which is broken down by to the block group level and overlaid with Philadelphia’s Planning Districts), where average public transit commute rates are much higher or lower than this 26% average.

Tidbit Tuesday — Who commutes to work by car?

Every Tuesday, the Mayor’s Office of Transportation & Utilities (MOTU) posts a map or graphic that tells a story about transportation or utilities in the City of Brotherly Love.   This week we are beginning a 3-part series exploring how people commute to work. To start this series off, we will be taking a look at where people live if they are commuting by car, truck, or van.

CTV Commute

According to the 2007-2011 American Community Survey, 60% of Philadelphians commute to work by car, truck, or van.  While this may be the average, there are many communities in Philadelphia, as can be seen by the above map (which is broken down by to the block group level and overlaid with Philadelphia’s Planning Districts), where average car, truck, or van commute rates are much higher or lower than this 60% average.

Tidbit Tuesday — Have you parked at any of Philadelphia’s on-street bicycle corrals?

Every Tuesday, the Mayor’s Office of Transportation & Utilities (MOTU) posts a map or graphic that tells a story about transportation or utilities in the City of Brotherly Love.

bicyclecorrallocations [Converted]-01

This map displays the eight on-street bicycle corrals throughout Philadelphia.  Each bicycle corral can park up to 12 bicycles in the space of one car parking space.  How many of these bicycle corrals have you parked at?

Tidbit Tuesday — How does Philadelphia commute to work?

Every Tuesday, the Mayor’s Office of Transportation & Utilities (MOTU) posts a map or graphic that tells a story about transportation or utilities in the City of Brotherly Love.

ModeShare_2010_PlanningDistrict

This map illustrates the variety of ways in which Philadelphians commute to work and how this choice in transportation mode varies across the city.  How do you get to work?